

Read our press statement below to find out …….. it’s a bit shocking!!
“New analysis shows Kapiti’s rates less affordable than all major cities in New Zealand
A recent Infometrics report for the Wellington City Council shows that Wellington rates were amongst the least affordable in New Zealand. But a new analysis by Concerned Ratepayers Kapiti shows that Kapiti’s rates are significantly less affordable that Wellington’s – and all the other cities covered by the Infometrics report.
Rates affordability is commonly measured by the cost of rates as a proportion of median household income in a region. The recent Infometrics report shows that total Wellington rates – including city council and regional council rates – are 4.7% of median household incomes across Wellington city. This was marginally better than Dunedin and Tauranga, whose total rates were 4.8% of median household income.
Concerned Ratepayers Kapiti – a local residents’ group – replicated the analysis for Kapiti’s ratepayers. Its analysis includes Kapiti Coast District Council (KCDC) rates and Greater Wellington Regional Council (GWRC) rates, to make it comparable with the Infometrics report.
“Our analysis shows that total rates in Kapiti take up between 5.1% and 6.5% of median household income in Kapiti, depending on where people live” said Chris Harwood, Chair of Concerned Ratepayers Kapiti. “This is way higher than the supposedly unaffordable rates in Wellington and other cities”.
“Total rates in Kapiti are about the same level in dollar terms as Wellington city, but median household incomes in Kapiti are much lower,” said Chris. “That’s because Kapiti has a much higher proportion of people living on NZ Super and others on lower incomes. And KCDC’s own analysis of rates affordability typically excludes GWRC rates, so KCDC’s numbers tell only part of the story”.
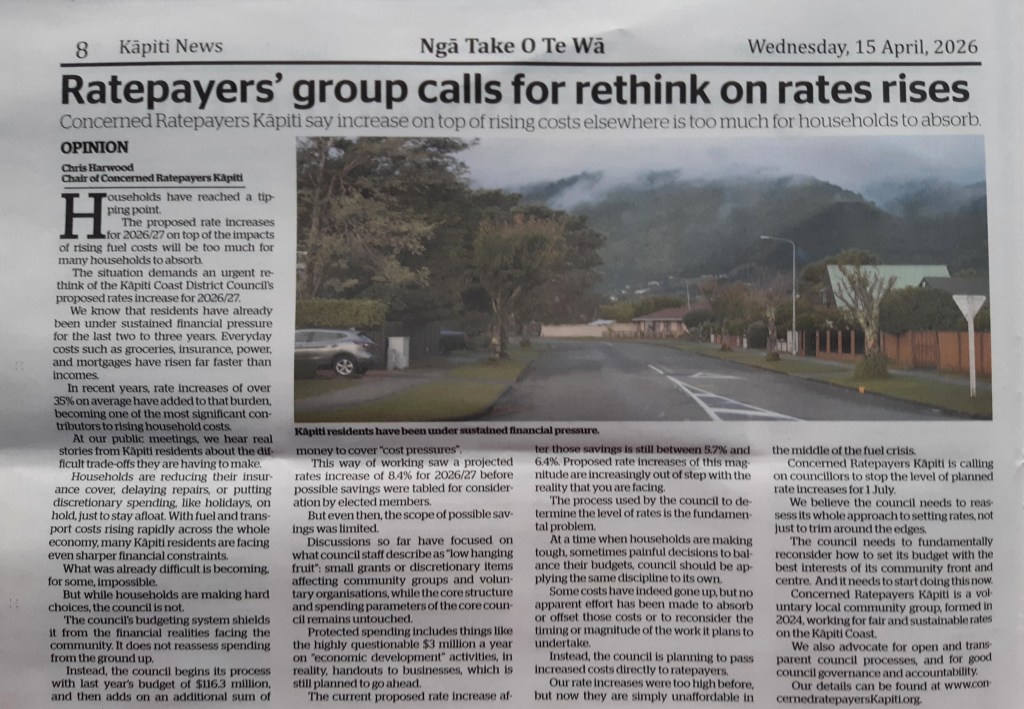
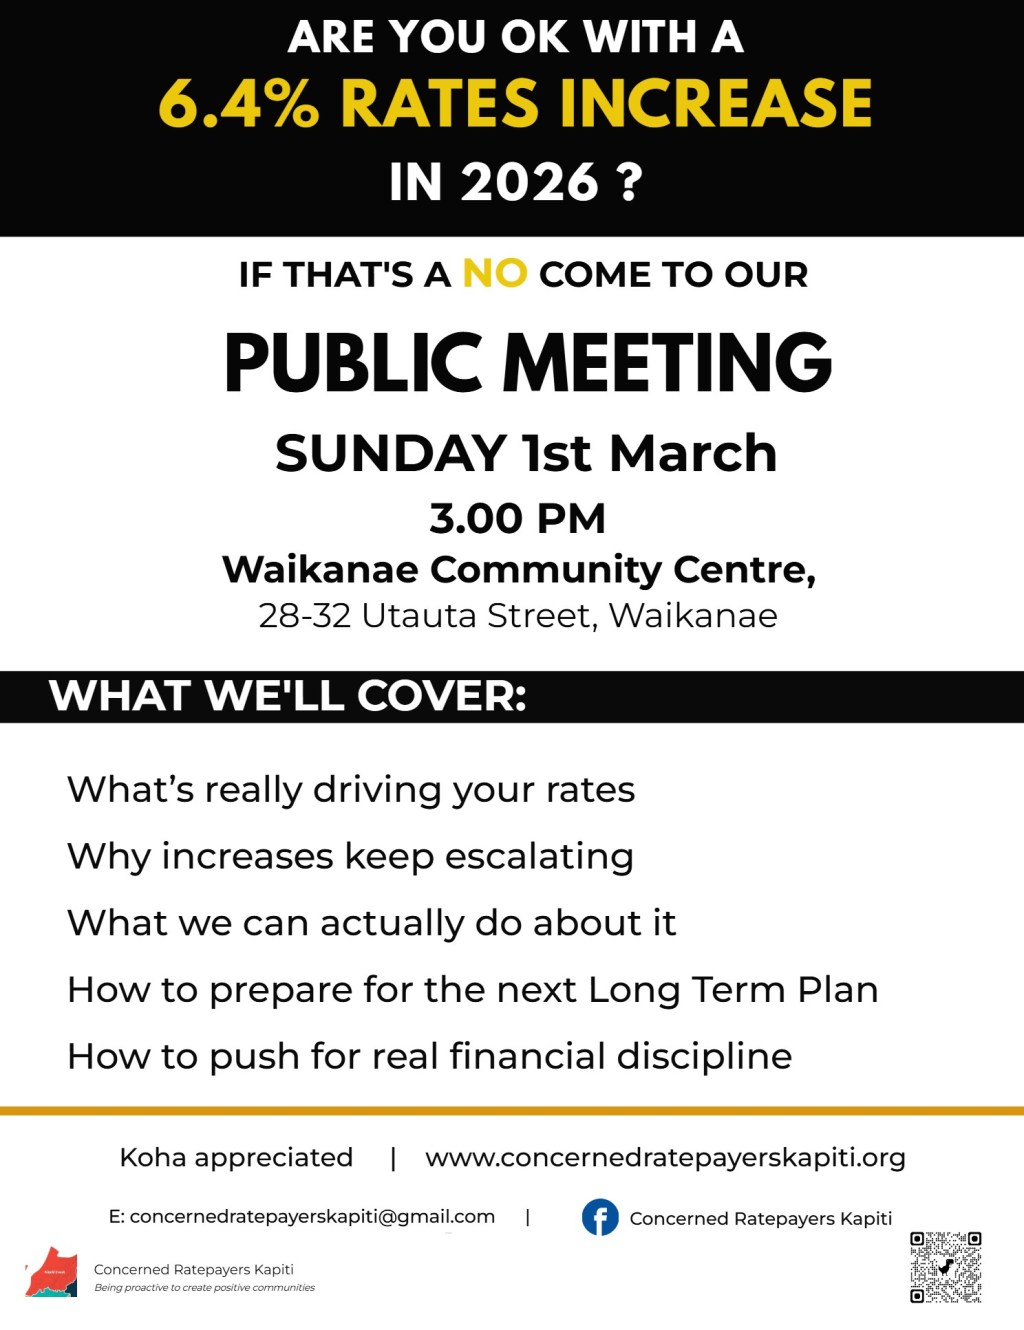
“KCDC is planning average rates increases of between 5.7 and 6.4% for the coming year, which will make a terrible situation even worse,” said Chris.
“We have repeatedly raised these issues with local Councillors but they are deaf to our concerns. At our public meetings, we hear real stories from Kapiti residents about the difficult trade-offs they are having to make. Households are reducing their insurance cover, delaying repairs, or putting discretionary spending, like holidays on hold, just to stay afloat”.
Chris Harwood said that Concerned Ratepayers Kapiti recently wrote to all Kapiti Councillors asking for a rethink of their planned rates increases for 2026/27 in light of the fuel crisis. “But our request was summarily dismissed by Mayor Janet Holborow within 3 hours of our letter being sent to Councillors. This is yet another sign of how indifferent Councillors are to the financial pain that rates are causing for our community”.
“I’m sorry to say that Mayor Holborow is leading a Council that just doesn’t seem to care,” said Chris. “And many of our Councillors seem to have forgotten the promises they made during the last election to lower rates increases”.
Harwood said that Concerned Ratepayers Kapiti would continue to fight for a lower and more affordable rates path. “Because it’s too important not to. We need to stand up for our community, because with rates already at 6.5% of median household incomes, KCDC is already driving our residents into financial despair”.
And for those wanting to delve into the detail …….
KAPITI RATES AFFORDABILITY – CALCULATIONS AND TECHNICAL ASSUMPTIONS
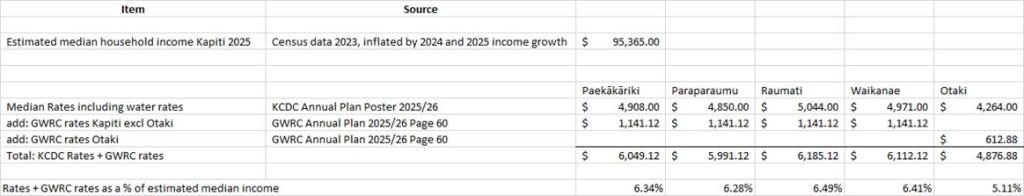
Our calculations of rates affordability – as a percentage of household median income for Kapiti residents – is set out in the table below:
Assumptions and data sources:
Kapiti Household Median Income:
- 2023 census data estimated median household income in Kapiti is $85,200 (Source: https://tools.summaries.stats.govt.nz/places/TA/kapiti-coast-district#total-income).
- To align with the 2025 Household Income figures used in the Infometrics report commissioned by Wellington City Council, this figure needs to be adjusted to 2025 levels. We have made two annual adjustments – income growth of Household incomes grew on average by 6.5% in 2024 (Source: https://www.stats.govt.nz/information-releases/household-income-and-housing-cost-statistics-year-ended-june-2024/#:~:text=average%20annual%20household%20income%20(gross,to%20the%20June%202024%20quarter) and Household incomes grew on average by 5.1% in 2025 – see https://www.stats.govt.nz/news/increasing-household-income-offset-by-higher-housing-costs-in-year-to-june-2025/#:~:text=to%20June%202025-,Increasing%20household%20income%20offset%20by%20higher%20housing%20costs%20in%20year,of%20$505.50%20on%20rent%20payments). The resulting mathematics is: $85,200 x 1.065 = $90,738. We then multiply $90,738 x 1.051 = $95,365
We are aware that KCDC uses median household income data that is considerably higher than what real Census data show. In the KCDC’s Long Term Plan, page 39, KCDC estimates that the median household income in 2025 as being about $107,535 – which is about 12½% higher than Census-backed data. We are not aware of the Council’s source for their estimate – but it is not backed by (adjusted) 2023 Census information.
We are also aware that incomes in the Otaki district are, on average, somewhat lower than for the rest of the Kapiti region. But in the absence of official data (that we could find) to estimate the household income difference, we have used the district wide median household income for Otaki. The effect will be to understate the rates affordability challenge for Otaki residents.
KCDC Median Rates by district in the Kapiti region
- KCDC figures taken from the KCDC Annual Plan “Poster” 2025/26 (source: https://www.kapiticoast.govt.nz/media/ge4dbd01/annual-plan-poster-final.pdf)
GWRC Rates for Kapiti Residents
- From the GWRC Annual Plan 2025/26, table page 60 (source: https://www.gw.govt.nz/assets/Documents/2025/07/Annual-Plan-2025-working-file-1.8-web.pdf)
Infometrics Report for the Wellington City Council
Can be found here: https://wellington.govt.nz/-/media/news-and-events/news-and-information/news/files/2026/Infometrics-WCC-rates-affordability.pdf
Original media reporting of the Infometrics report for Wellington City Council Can be found here: https://www.thepost.co.nz/nz-news/360981126/new-report-shows-wellington-rates-now-among-nzs-least-affordable

Leave a reply to concernedratepayerskapiti Cancel reply