

If we’re to make informed decisions, it’s essential to understand how public funds are allocated. Below is a summary of spending by various departments within the council, based on publicly available data.
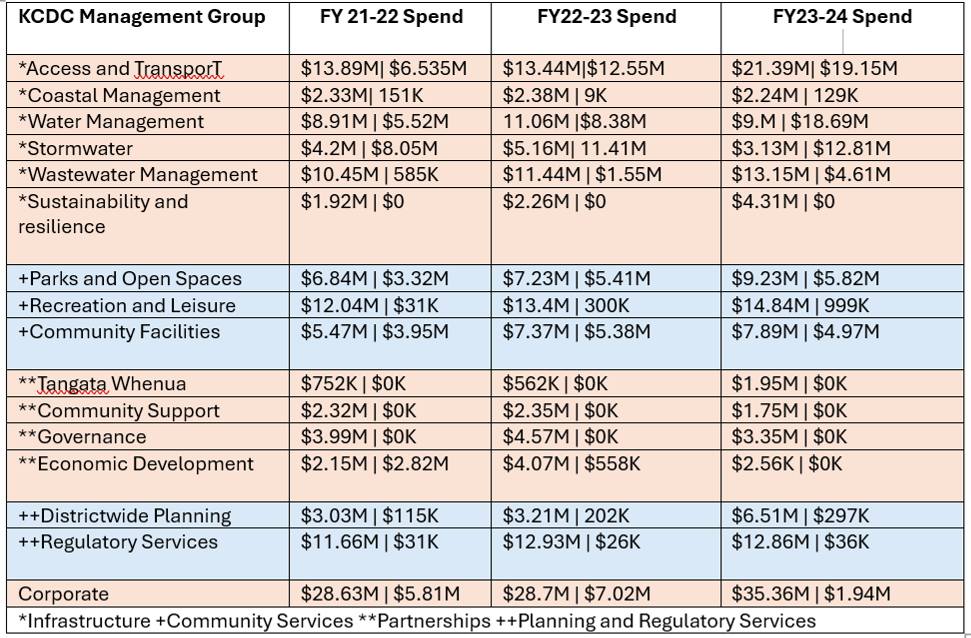
The table below condenses this information into operational and capital spending figures for the last three fiscal years (FY21-22, FY22-23, FY23-24).
Key Points:
Operational Spend: The left-hand number in each column shows annual operational costs.
Capital Spend: The right-hand number represents capital investments, paid down over time through depreciation.
This breakdown covers areas such as infrastructure, community services, partnerships, and planning/regulatory services. All numbers are rounded to two decimal places.
Why This Matters:
These figures are purely factual and presented without bias or opinion. They provide transparency about how resources are distributed across different departments. Understanding this data helps us engage in meaningful discussions about priorities and improvements and the ways we approach future spending as a community.
Note: This information is sourced directly from council data.


Leave a comment